-
Last year, some groups of students in their community made a survey (调查) about “How do people spend their free time? ” The following diagrams(图表) show some results(结果) of it:
Diagram (1): Hours for people of different ages who search the Internet in a week.

Diagram (2): Different days people go to the library. (library attendance出席)

Diagram (3): Different programs (节目) people like.

1.People aged spend the most time searching the Internet every week.
A. 7-16 B. 17-30
C. 31-55 D. over 56
2.How many people go to the library on Monday?
A. About 20% B. About 60%
C. Over 80% D. More than 40%
3.Which program do people like best?
A. Cartoons B. Sports
C. News D. Music
4.The three diagrams show us the results of a survey about .
A. what people do every day B. people’s different habits
C. people’s different lifestyles D. how people spend their free time
-
Last year, some groups of students in their community made a survey( 调查) about “How do people spend their free time?” The following diagrams(图表) show some results(结果) of it:
Diagram (1): Hours for people of different ages who surf the Internet in a week.
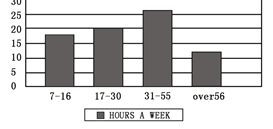
Diagram (2): Different days people go to the library. (library attendance 出席)

Diagram (3): Different programs people like.

1.People aged spend the most time surfing the Internet every week.
A. 7—16 B. 17—30 C. 31—55 D. over 56
2.How many people go to the library on Saturdays?
A. About 20%. B. About 40%. C. Over 60%. D. More than 80%.
3.The three diagrams show us the results of a survey about .
A. what people do every day B. people’s different habits
C. people’s different lifestyles D. how people spend their free time
-
Last year, some groups of students in their community (社区) made a survey about “How do people spend their free time? ” The following diagrams(图表) show some results of it:
Diagram (1): Hours for people of different ages who surf the Internet in a week.

Diagram (2): Different days people go to the library. (library attendance出席)

Diagram (3): Different programs people like.

1.People aged spend the most time surfing the Internet every week.
A. 7—16 B. 17—30 C. 31—55 D. over 56
2.How many people go to the library on Saturdays?
A. About 20%. B. About 40%. C. Over 60%. D. More than 80%.
3.The three diagrams show us the results of a survey about .
A. what people do every day B. people’s different habits
C. people’s different lifestyles D. how people spend their free time
-
It was the last day of the final exam in a college. Outside the classroom, a group of students were waiting for the last exam. On their faces was confidence.
They knew the exam would be easy. The teacher said they could bring any books or notes during the test.
Right after they came into the classroom. The teacher handed out the papers. There were only five questions on it.
Three hours passed. Then the teacher began to collect the papers. The students no longer looked confident but they looked very nervous. The teacher watched these worried faces, and then asked. “How many of you finished all five questions?” No one answered. “How many of you answered four?” Still no one put up the hand. “Three? Two?” The students moved restlessly(不安地)in their seats. “One, then? Certainly somebody finished one.” But the class kept silent(沉默). The teacher said, “That is what I thought. I just want to make you know clearly that you finished four years of study, but there are still many things about the subject you don’t know. These questions you could not answer are common(常见的) in everyday life.” Then, he smiled and said “You will all pass this exam, but it doesn’t mean that you learned the subject well. There are still more things for you to learn in your later life.”
Now we can’t remember the name of this teacher clearly, but we can’t forget the lesson he taught us.
1..Why did the students think the exam was easy at first?
A. Because it was their last exam in the college.
B. Because they knew there were only five questions.
C. Because they thought they were clever and talented.
D. Because they could bring any books and notes into the classroom during the test.
2.How many students have finished all the five questions?
A. All of them. B. Some of them
C. None of them. D. Only one of them.
3.What does the underlined word “confident” mean in the text?
A.糊涂的 B.放松的 C.自信的 D.紧张的
4.What can the students learn from the last exam?
A. He laughs best who laughs last.
B. A good beginning is half done.
C. One is never too old to learn.
D. The early bird catches the worm.
5.What’s the best title for the article?
A. Some confident students. B. An easy exam.
C. An interesting teacher. D. An unforgettable lesson.
-
完形填空(共10小题;每小题0.5分,满分5分)
Every year students in many countries learn English. Some of these students are children, __ students are young people. Why do all these people want to learn____? It is not___to answer this question. Many boys and girls learn English at school. It is one of their __. Many people learn English because it is___in their work. Some young people learn English___their higher studies because some of their books are____English. Other people learn English because they want to ___newspapers in English. Some people learn English because they want to _ in the USA, England or Australia. English is very___in our life (生活).
1.A. all B. the other C. both D. other
2.A. English B. Chinese C. maths D. Japanese
3.A. hard B. easy C. good D. nice
4.A. books B. classes C. schools D. subjects (科目)
5.A. good B. useful (有用的) C. fine D. pleased
6.A. for B. of C. to D. from
7.A. in B. with C. at D. of
8.A. look B. see C. look at D. read
9.A. go B. work C. like D. come
10.A. help B. helping C. helps D. helpful
-
Can you name some foods in the meat group? Can you tell where they come from? Your body is made up of millions of cells. Cells are very small.
Your body has to make new cells in order to grow. It also has to make new cells to take the place of the old cells that have been worn out.
To grow, the cells need a thing called protein. The protein you need mostly comes from foods in the meat group.
Fruit and vegetables are plant foods. Foods in this group give your body vitamins and minerals. Your body needs vitamins and minerals to grow and to stay well.
The third food group is made up of bread.These foods come from grain. Your body gets heat and energy from these foods. It needs a lot of energy to work and play.
Milk is one of the best foods your body can get. It has protein, vitamins and minerals. Milk is good between meals or with meals.
1.In order to grow, your body_______ .
A. has to make more water B. needs less protein
C. has to make new cells D. needs old cells
2.In order to grow, the cells need _______.
A. food B. protein C. meat D. bread
3.The protein comes mostly from ________.
A. milk B. fruit C. bread D. meat
4.Vitamins come from__________ .
A. protein B. fruit and vegetables C. fat D. new cells
5.Milk has _________ in it.
A. meals B. body C. minerals D. bread
-
Many people like to travel during their vacations(假期). Some people travel in tour groups because they think it is safe and cheap. A tour guide takes care of the group and makes sure the group can see a lot of interesting and beautiful sights. Other people like traveling alone or with friends. If you travel by yourself, you are free to see what you want to see.
People travel for many reasons. Some people travel to learn more about other countries’ people, culture, food and languages. Some people travel for adventure(冒险). They want to do some different things, such as skiing, bungee jumping(蹦极跳) and mountain climbing. Other people like to shop when they travel. They look for new things or cheap ones.
There are different ways to travel. Some people take trains, boats or buses, some fly, and others drive cars. Some people like to travel slowly and spend a long time in each place, while others like to take quick tours and visit more places in a short time.
1.What does “sights” mean in Chinese in the first paragraph?
A. 视力 B. 看见 C. 风景 D. 情景
2.Why do some people like traveling alone ?
A.Because they want to see interesting sights.
B.Because they have different ways to travel.
C.Because they are free to see what they want to see.
D.Because they want to learn more about people from other countries.
3.According to the passage, people travel for_______.
A. adventure B. learning more about another country
C. Shopping D. all of the above
4.Some people take quick tours because_______.
A. they travel by car.
B. they like to visit many places in a short time
C. they have much time for travelling
D. they want to spend a long time in each place.
5.If a person travels for adventure, he may choose ______ to get a different experience.
A. eating B. shopping
C. bungee jumping D. sleeping
-
A group of old classmates, who have succeeded in their work, got together to visit their old university professor. The conversation soon turned to complaining about the stress in work and life. Offering his guests coffee, the professor went to the kitchen and returned with a large pot of coffee and many cups-china(瓷), plastic and glass, some plain(朴素的) looking, some expensive and some lovely. The professor told them to help themselves to the coffee.
When all the students had a cup of coffee in hand, the professor said, “Can you notice all the nice looking expensive cups were taken, leaving behind the plain and cheap ones? While it is normal for you to want only the best for yourselves, that is the source(根源) of your problems and stress.”
“What all of you really wanted was coffee, not the cup, but you went for the best cups and were eyeing each other’s cups.”
“Now think about this: life is the coffee, and the jobs, money and position in society are the cups. They are just tools to hold and contain life, and do not change the quality of life. Sometimes, by concentrating only on the cups, we fail to enjoy the coffee. So don’t let the cups drive you, enjoy the coffee instead.”
1.What did the group of old classmates get together for?
A.Visiting their old university professor.
B.Seeing each other.
C.Complaining about their stress in work and life
D.Showing each other’s success.
2.What cups did the old professor give to his students?
A.All china cups.
B.Plastic and glass ups.
C.Beautiful cups.
D.Cups which are different in price, material and appearance.
3.According to the old professor, why did they have so much stress?
A.Because they paid too much attention on things that were not important.
B.Because they caught the main point of the meaning of life.
C.Because they concentrated on life and enjoyed it.
D.Because they drank too much coffee which was bad for them.
4.What is the best title of this passage?
A.Life Is the Coffee
B.An Old University Professor
C.Stress in Your Life
D.Coffee and Coffee Cups
5.What can we learn from the old professor’s words?
A.We should use the plain and cheap cups to drink coffee.
B.We should concentrate on the appearance of cups.
C.We should concentrate on life itself but not other unimportant things
D.We should learn how to work out problems in our work and life.
-
Kitty's teachers made some rules for their subjects.
Chinese: You must take notes(做笔记)in class and learn the important articles by heart. We have a test every month.
Math: You have to bring your rulers and calculators to math class. Listen carefully in class and read carefully when you do math problems. We have a test every month.
English: You must take notes in class. Also you have to read aloud every morning and listen to the tape before doing homework. We have a test every week.
Science: You must underline(在……下画线)the important points. Watch carefully when the teachers do experiments(实验)and take notes.
Art: Bring your pencils every lesson. And bring your brushes,paint and palettes(调色盘)if I tell you.
Music: Go to the music room to have class. Remember to be quiet.
P.E.: Remember to wear sports shoes and sports suits(运动服)when you have a P.E. class.Go to the gym and stand in line when the bell(铃声)rings.
1.How many subjects does Kitty have rules for?
A.Seven. B.Eight. C.Nine. D.Ten.
2.What does the underlined word “calculators” in Paragraph 3 probably mean?
A.笔 B.尺子 C.耳机 D.计算器
3.Which subject has a test every week?
A.Chinese. B.Math. C.English. D.Science.
4.What must Kitty bring to school for every art lesson?
A.Pencils. B.Brushes. C.Paint. D.Palettes.
5.Which is NOT true?
A.Kitty is a student. B.Kitty has to bring her ruler and calculator to math class.
C.Kitty has music class in the music room. D.Kitty can wear dresses to school every day.
-
Mr. Smith is a teacher. Yesterday he did a survey of what his students did on their last weekend and this is what he learned.
Linda went to see her grandparents. Her grandparents live in the countryside. They are very old. But they don’t like to live in the city. They want to have a quiet life. Tom helped his parents do some housework. He cleaned the room, took out the trash(垃圾), washed all the clothes. At noon, he helped his mother cook lunch. Mary looked after her little brother because her mother was ill. Her father had to look after her mother in the hospital. Mike studied history at home. He isn’t good at history. He thinks it is too difficult for him. His father helped him. Both his father and his mother hope that Mike can be good at all his subjects. They want him to study in a famous university one day.
1.What did Linda do last weekend? She __________.
A.helped her parents B.went to see her grandparents
C.wants to have a quiet life D.likes to live in the city
2.What did Mary’s father have to do? He __________.
A.looked his little son B.helped cook lunch
C.had to look after Mary’s mother D.washed all the clothes
3.Who helped Mike study history at home?
A.his father B.his mother C.his mother and father D.his teacher