-
阅读下面图文,简要回答所给问题。
The bar chart shows the number of men and women students studying engineering at Australian universities between the year 1998 and 2018 at tenyear intervals(间隔).
We can learn that the number of male students fell slightly from 14,000 in 1998 to 12,000 in 2008, and then remained the level through the following decade(十年). The number of female students was relatively small, starting 2,000 in 1998.And then it rose slowly, and in 2018 the number was 6,000.

1.What does the bar chart show us?
______________________________________ .
2.How many men students chose engineering in 1998?
______________________________________ .
3.When was the number of female students studying engineering 6,000?
______________________________________ .
4.How long does the survey last?
______________________________________ .
5.What do you think of the changes in the chart?
______________________________________ .
-
阅读下面图文,简要回答所给问题。
Living in the age of “Internet+”, more and more electronic products and apps have changed people's lifestyles in many ways, such as reading habits and sports events.
Electronic Reading
Instead of reading paper books, more people like to use electronic devices(设备) to read in China now. The reading time spent on them is getting longer. Chart Ⅰ shows different reading time from a survey. However, even though people spend much time on ebooks, the traditional paper books are still popular among readers. Research has shown that readers remember more information from paper books than ebooks. To our great joy, the number of books that each person read in 2016 in China reached 7.86, which increased a lot more than before.
| Ways | Reading Time (per person, per day; minutes) |
| Smartphones (智能手机) | 74.4 |
| WeChat | 26 |
| Newspapers | 13.15 |
(Chart Ⅰ) 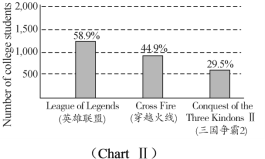
Electronic Sports
Just like soccer, basketball and baseball, esports has become very popular around the world. Esports is short for electronic sports. It is more than just children playing games in their bedrooms. In esports, teams of gamers play electronic games in front of many people and compete. And they need to put in a lot of hard work and training. ChartⅡshows the top three most followed esports among Chinese college students from a survey last year.
Actually, eproducts play an important role in our daily life. They have not only changed our life but also made the world colorful. One coin has its two sides. As teenagers, if we put the eproducts into good use, they can add more fun to our life and become good helpers to our study.
1.According to the passage, why are the paper books still popular among readers?
__________________________________________________________ .
2.ChartⅠshows the reading time on WeChat is more than that on newspapers. How much more time?
__________________________________________________________ .
3.Do you like reading paper books or electronic books? Why?
__________________________________________________________ .
4.We can draw a conclusion that many young people want to be a hero in their mind from ChartⅡ. How can you know it?
__________________________________________________________ .
5.In the age of “Internet+”, what influence do you think the eproducts have on us?
__________________________________________________________ .
-
阅读下面图文,简要回答下面的问题。
Strathnaver Museum is situated on the north coast of Scotland .It is based in the former Parish Church of Columba in Bettyhill and opened as a museum in 1976 .Its main theme is the tragic story of the Highland Clearances .It has a room dedicated to the Clan Mackay and also tells the story of crofting life .
Open April to October
9am to 11 am
2pm to 5pm
Closed Sundays
Adults £2.00
Concessions £1.50
Students £1.00
Children £0.50
Clachan, Bettyhill ,Sutherland ,
KW14 7SS
Tel : 01641 521418
E-mail : strsthnavermus @ukonline.co.uk
www.strathnavermuseum. org.uk
1.What’s the name of the museum?
2.How long is the museum open in the afternoon?
3.On what day is the museum closed?
4.Who pay the most for tickets ?
5.In which country is the museum ?
-
请阅读下面图文,简要回答所给问题。
Before you visit a country, knowing about the customs of the country is important and useful. Here are 4 customs you should know before traveling to Japan.
No. 4 is avoided at all cost.
In Japan, the number "four" is avoided because it sounds very similar to the word for death. No. 4 is very unlucky as No, 13 in Western culture. And it is used as little as possible. You must always avoid giving anyone something in fours because it can be seen as a very ominous(不吉利的)gt.No.49 is especially unlucky, as it sounds similar to the phrase that means "pain until death". The practice of avoiding No. 4 is called" Tetraphobia (四的禁忌)" and it is common in many East Asian and Southeast Asian regions .
People will sleep on the trains with their head on your shoulder.
If someone in Japan falls asleep with his or her head on your shoulder, it is common practice to Just tolerate(容忍) it, because the place where most people work is far from their homes. After working long hours, many people will get very tired and often fall asleep on the train.
You must always bring a host a gift.
If you want to visit someone, you must always bring a gift. The gift shoud also be wrapped (包). You should also never refuse a gift if someone visits you.
Pouring your own glass is considered rude.
It is common in the US and many other countries in the world to serve others before you serve yourself, _____in Japan you shouldn't pour yourself a drink. If you have poured for others, another guest will hope to see that your drink is empty and pour for you.
66题完成句子;67~68题简略回答问题;69题找出并写下全文的主题句;70题将文中画线句子译成汉语
1.In Japan "four sounds very similar to the word "______"
2.Which number is unlucky in Western countries?
__________________________________________
3.Why can you see some people sleeping on the trains after work in Japan?
______________________________________________
4._____________________________________________________
5._______________________________________________________
-
阅读下面图文,简要回答所给问题。
Girls in their teens easily make a lot of mistakes when it comes to food. It's the age that makes a girl most enjoy having junk food. The chart shows the result of a survey on junk food for 600 girls. Here is some advice on how to eat healthily.
A Heavy Breakfast
Not having breakfast in the morning is a bad habit. It's because your stomach remains empty the whole night. So you can plan your breakfast this way. Have healthy drinks. Make brown bread and add low fat butter on it. You can also have an egg. It doesn't take much time to prepare and you can easily have them before going to school.
A Moderate Lunch
If you eat a heavy meal during your lunchtime, then you will end up feeling sleepy for the rest of a day.The choices for lunch are chicken, meat and vegetables. Have fish as often as you can and have brown rice sometimes. Chicken sandwiches are not only healthy but also delicious. Keep lunch simple and avoid adding too much oil and salt.
A Light Dinner
Keep your dinner as little as possible. For dinner, you can have a small serving of vegetables and soup. Having a light dinner is a right way to lose weight. You can also drink a cup of healthy drink, fruit smoothie or milk after dinner. When you keep your dinner light, your digestive system(消化系统) only takes very little time to break down and take in the food. This keeps a balance in your health.
1.According to the chart, how many girls of 600 prefer soft drinks?
_________________________________________ .
2.According to the chart, what kind of junk food do the most girls like?
_________________________________________ .
3.Why is it a bad habit not to have breakfast?
_________________________________________ .
4.What will happen if you have a heavy meal during lunchtime?
_________________________________________ .
5.Do you have a healthy eating habit? What do you think of it?
_________________________________________ .
-
任务型阅读,阅读下文并回答问题。
Almost everyone knows the meaning of Mr., Mrs. and Miss. People use Mr. with men’s last names. And Mrs. is for married women and Miss is for single (单身的) women. But what is Ms?
For some time, people in the United States use Ms. before a woman’s name when they do not know whether the woman is married or not. Today many people like to use Ms. Some women feel that it is not important for people to know whether they are married or not.
There are some problems with Ms. Not all women like it. Some like the old ways of doing things. They find it difficult to pronounce (发音) the word. But young people like it.
1.What do people usually use before married women’s name?
________________________________________________.
2.When do people use Ms. before a woman’s name?
________________________________________________.
3.Is it difficult to pronounce the word “Ms.”?
______________________________________________
-
阅读下列图文,简要回答所给问题。
A growing number of families are sending children on study tours abroad.
Some parents are worried that their children are too young to deal with any problems they might face during a trip. However, some believe they could take care of themselves and communicate with people well during the trip.
A report shows that at least 800,000 overseas study tours were booked for Chinese children during the summer vacation. Each tour cost an average of 25,000 yuan($3,770) per person, and most were booked(预订) by middleclass families in large cities for prehigh school children, according to the report. About 13 percent were booked for children ages 3 to 6, while those ages 7 to 12 are 31 percent.
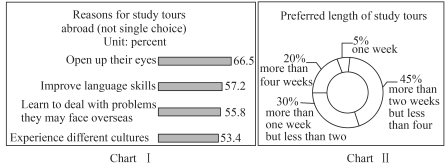
Besides the United States and the United Kingdom, countries in Africa, South America and Southeast Asia are becoming popular in recent years. You can get more facts from the following charts.
1.What are some parents worried about if they send their children on study tours abroad?
___________________________________________________________ .
2.Who were most of the study tours abroad booked for?
___________________________________________________________ .
3.What percent of the people want to experience different cultures through study tours abroad?
___________________________________________________________ .
4.How long do 20 percent of the people want to study abroad?
___________________________________________________________ .
5.Will you take a study tour in foreign countries? Why or why not?
___________________________________________________________ .
-
The number of teachers in our school ________ 60 and a number of them ________ men teachers.
A. is;is B. is;are C. are;is D. are;are
-
阅读下面图文,简要回答所给问题。
Since China carried out it's help to the poor policy, the government has took many measures to make sure that people from poor families can go to hospital. At the same time, all hospitals have set up a “green channel” to provide poor people who cannot afford medical treatment with financial(经济的) support.
Some hospitals are also taking their own steps to provide assistance(援助). One of the hospitals in Hangzhou has set up an online charity community called “i-home”, which is set up specially for poor patients. They can communicate about their problems with doctors online before they go to hospitals. The “i-home” also provides interest-free(无息的) loan(贷款) for poor patients.
Zhang Kai, who came from a rural family in Zhejiang, said his family sank into hopelessness when his father was found to have a rare(罕见的) disease. The treatment would cost 30,000 yuan and his family couldn't afford it at all.
A teacher called to tell him how to use the “i-home” system and how to get help from the “green channel”. Zhang Kai said,“I have received a 5,000 yuan loan from the ‘i-home’. And the hospital has also agreed to reduce the medical fee(费用) by 10%.” He said he now has nothing to worry about. “As I will graduate from university in a month and I have found a job in a company, I will help my father to pay back the loan.”
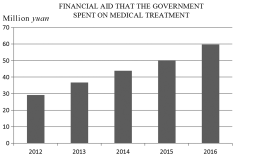
1.How much did the government spend to provide financial help in 2016?
____________________________________________ .
2.Is “i-home” set up to help poor students with their living expenses?
____________________________________________ .
3.Why did Zhang Kai's family sink into hopelessness?
____________________________________________ .
4.According to the passage, how much more will Zhang Kai's family need for the medical fee besides assistance from the “i-home” and the hospital?
____________________________________________ .
5.What do you think of “i-home”? Why?
____________________________________________ .
-
The students of after-zero have different ways to relax themselves. The chart shows the result of the survey among 400 students. The number of the students who play computer games is ________.
| Read books | Listen to music | Play computer games | Play ball games |
| 20% | 100 | ? | 30% |
A.80 B.100 C.120