-
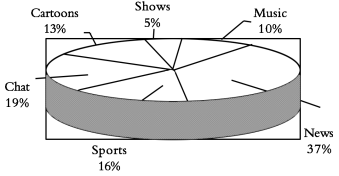
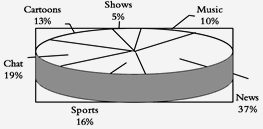
Last year, some groups of students in their community (社区) made a survey about "How do people spend their free time?" The following diagrams show some results of it:
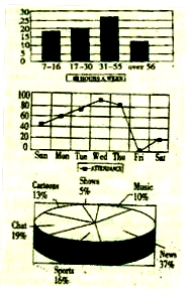
Diagram (1): Hours for people of different ages who surf the Internet in a week.

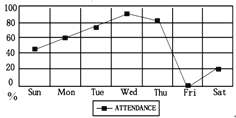
Diagram (2): Different days people go to the library. (library attendance)
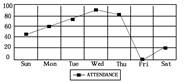
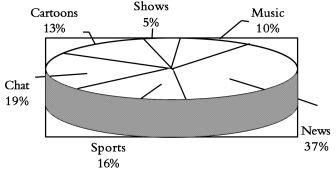
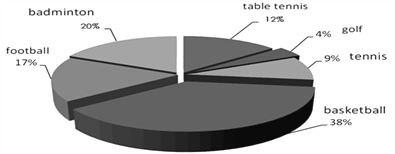
Diagram (3): Different programs people like.

根据上面三个图表内容,选择正确答案。
1.People aged ________ spend the most time surfing the Internet every week.
A.7—16 B.17—30 C.31—55 D.over 56
2.The word "attendance" in Diagram (2) means " ________ in the library".
A.the hours people spend B.the number of people
C.the number of books D.the days people spend
3.On weekends, ________ people go to the library every week.
A.over sixty B.less than sixty
C.about twenty D.more than one hundred
4.Which of the following is true according to the diagrams?
A.The fewest people like watching music.
B.Sports are the most people's favorite programs.
C.People seldom go to the library on weekdays.
D.Half of the people like watching news or cartoons.
5.The three diagrams show us the results of a survey about ________.
A.what people do every day
B.how people spend their free time
C.people's different lifestyles
D.people's different habits
-
Last year, some groups of students in their community (社区) made a survey about “How do people spend their free time? ” The following diagrams(图表) show some results of it:
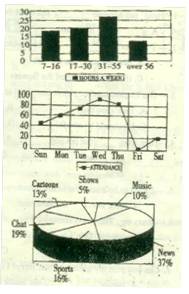
Diagram (1): Hours for people of different ages who surf the Internet in a week.
Diagram (2): Different days people go to the library. (library attendance)

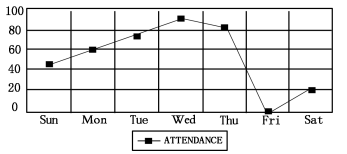
Diagram (3): Different programs people like.
1.People aged spend the most time surfing the Internet every week.
A. 7—16 B. 17—30 C. 31—55 D. over 56
2.The word “attendance” in Diagram (2) means “ in the library”.
A. the hours people spend B. the number of people
C. the number of books D. the days people spend
3.How many people go to the library on Saturdays?
A. About 20%. B. About 40%.
C. Over 60%. D. More than 80%.
4.Which of the following is TRUE according to the diagrams?
A. The fewest people like watching music programs.
B. Sports are the most people’s favorite programs.
C. People seldom go to the library on weekdays.
D. Half of the people like watching news and cartoons.
5.The three diagrams show us the results of a survey about .
A. what people do every day B. people’s different habits
C. people’s different lifestyles D. how people spend their free time
-
阅读下面短文,从每题所给的四个选项(A、B、C和D)中,选出最佳选项。
Last year some groups of students in their community(社区) make a survey about "How do people spend their free time?' The following diagrams (图表) show some results of it.
Diagram (1): Hours for people of different ages who surf the Internet in a week.
Diagram (2): Different days people go to the library.(library attendance)
Diagram (3): Different programs people like.
根据上面三个图表内容,选择正确答案
1.People aged__________spend the most time surfing the Internet every week.
A.7 ---6 B.17 ------ 30
C.31 ----- 55 D.over 56
2.On Wednesday, __________people go to the library every week.
A.over sixty B.less than sixty
C.about twenty D.more than one hundred
3.According to the third diagram about ______of people like watching Cartoons?
A.16%. B.19%
C.13% D.37%.
4.Which statement is right according to the survey?
A.Some students made the survey in their school last year.
B.More people like sports than chat in the survey.
C.Less than 80 people join in the survey about library attendance.
D.People of different ages spend different time surfing the Int ernet.
5.The three diagrams show us the results of the survey about__________.
A.what people do every day
B.how people spend their free time
C.people's different lifestyles
D.people's different habits
-
阅读下面短文,从每题所给的四个选项(A、B、C和D)中,选出最佳选项。
A
Last year some groups of students in their community(社区) make a survey about "How do people spend their free time?' The following diagrams (图表) show some results of it.
Diagram (1): Hours for people of different ages who surf the Internet in a week.
Diagram (2): Different days people go to the library.(library attendance)
Diagram (3): Different programs people like.
根据上面三个图表内容,选择正确答案
1.People aged__________spend the most time surfing the Internet every week.
A. 7 ----16
B. 17 ------ 30
C. 31 ----- 55
D. over 56
2.On Wednesday, __________people go to the library every week.
A. over sixty
B. less than sixty
C. about twenty
D. more than one hundred
3.According to the third diagram about ______of people like watching Cartoons?
A. 16%.
B. 19%
C. 13%
D. 37%.
4.Which statement is right according to the survey?
A. Some students made the survey in their school last year.
B. More people like sports than chat in the survey.
C. Less than 80 people join in the survey about library attendance.
D. People of different ages spend different time surfing the Int ernet.
5.The three diagrams show us the results of the survey about__________.
A. what people do every day
B. how people spend their free time
C. people's different lifestyles
D. people's different habits
-
Last year, some groups of students in their community made a survey about “How do people spend their free time? ” The following diagrams show some results of it:
Diagram (1): Hours for people of different ages who surf the Internet in a week.
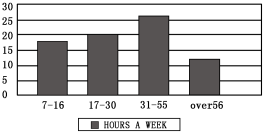
Diagram (2): Different days people go to the library. (library attendance)

Diagram (3): Different programs people like.
1.People aged spend the most time surfing the Internet every week.
A. 7—16 B. 17—30 C. 31—55 D. over 56
2. How many people go to the library on Saturdays?
A. About 20%. B. About 40%.
C. Over 60%. D. More than 80%.
3.Which of the following is TRUE according to the diagrams?
A. The fewest people like watching music programs.
B. Sports are the most people’s favorite programs.
C. People seldom go to the library on weekdays.
D. Half of the people like watching news and cartoons.
4. The three diagrams show us the results of a survey about
A. what people do every day
B. people’s different habits.
C. people’s different lifestyles
D. how people spend their free time
-
Last year, some groups of students in their community made a survey about “How do people spend their free time?” The following diagrams show some results of it:
Diagram (1): Hours for people of different ages who surf the Internet in a week.
Diagram (2): Different days people go to the library. ( library attendance )
Diagram (3): Different sports people like.
D (1) D(2)

 D (3)
D (3)
1.People aged spend the most time surfing the Internet every week.
A. 7~16 B. 17~30 C. 31~55 D. over 56
2.The word “attendance” in Diagram (2) means “ in the library”.
A. the hours people spend B. the number of people
C. the number of books D. the days people spend
3.How many people go to the library on Saturdays?
A. About 20%. B. About 40%.
C. Over 60%. D. More than 80%.
4.Which of the following is TRUE according to the diagrams?
A. The fewest people like playing tennis.
B. Football is the most people’s favorite sport.
C. People seldom go to the library on weekdays.
D. The most people like playing basketball.
5.The three diagrams show us the results of a survey about .
A. what people do every day B. people’s different habits
C. people’s different lifestyles D. how people spend their free time
-
Last year, some groups of students in their community made a survey about “How do people spend their free time? ” The following diagrams(图表) show some results of it:
Diagram (1): Hours for people of different ages who surf the Internet in a week.
Diagram (2): Different days people go to the library. (library attendance)

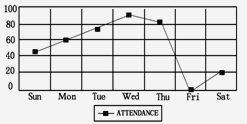
Diagram (3): Different programs people like.
1.People aged spend the most time surfing the Internet every week.
A. 7~16 B. 17~30 C. 31~55 D. over 56
2.How many people go to the library on Saturdays?
A. About 20%. B. About 40%. C. Over 60%. D. More than 80%.
3.Which of the following is TRUE according to the diagrams?
A. People seldom go to the library on weekdays.
B. Sports are the most people’s favorite programs.
C. The fewest people like watching music programs.
D. More people enjoy news programs than cartoons programs.
-
Last year, I went to Beijing Qizhi Special Education School for community service(社区服务).Before we took the bus, my friend asked me a question, “Why are you here?” I did not know how to answer the question.
The school was not far from my school, but it looked like it was in a different world. A group of children were waiting for us. A boy walked toward me. He held my hands and pulled me to the ground. I kissed the earth and tasted nature.
I could not understand what he was doing at first, then I was very angry. Though I was very angry, I controlled my anger.
A teacher stopped this awkward(尴尬的)silence when she shouted at the boy. “What are you doing right here, right now?” she said. “You will never see your mom again if you keep doing this. Now, say sorry!” “Sorry,” he cried fearfully and nervously. I said nothing, but I realized something about this child. After lunch I asked the teacher for information about the child’s parents.
She said that the child was very different from other students because of an illness. His family could not afford to treat him. He needed the kindness of his family, but they had abandoned him. So he depended on the support from the teachers and community service workers like us.
I suddenly realized I could answer the question my friend asked me at the beginning of the day.
Community service workers help others and make everyone feel better. There are so many people in the world that need help. Playing with lonely children may not make a big difference. But it can light a corner in the children’s hearts, making them know they are loved by people.
1.How did the writer reach Beijing Qizhi Special Education School?
A. By train B. By car. C. By bus. C. By taxi.
2.Why did the writer get angry?
A. Because a boy held the writer’s hands. B. Because the writer did not like to taste nature.
C. Because a boy pushed the writer to the ground. D. Because a boy was impolite to the writer.
3.The boy acted differently from others because _______.
A. he was sick B. his parents didn’t like him
C. he was nervous and fearful D. he always lived with teachers
4.The underlined word “abandoned” most probably means “_______”.
A. hurt B. left C. sold D. forgotten
5.From the passage we can learn that the writer __________.
A. helped so many people in the world B. played with the lonely boy after lunch
C. learned the meaning of community service D. wasn’t good at answering the questions about community service.
-
Last year, I went to Beijing Qizhi Special Education School for community service(社区服务).Before we took the bus, my friend asked me a question, “Why are you here?” I did not know how to answer the question.
The school was not far from my school, but it looked like it was in a different world. A group of children were waiting for us. A boy walked toward me. He held my hands and pulled me to the ground. I kissed the earth and tasted nature.
I could not understand what he was doing at first, then I was very angry. Though I was very angry, I controlled my anger.
A teacher stopped this awkward(尴尬的)silence when she shouted at the boy. “What are you doing right here, right now?” she said. “You will never see your mom again if you keep doing this. Now, say sorry!” “Sorry,” he cried fearfully and nervously. I said nothing, but I realized something about this child. After lunch I asked the teacher for information about the child’s parents.
She said that the child was very different from other students because of an illness. His family could not afford to treat him. He needed the kindness of his family, but they had abandoned him. So he depended on the support from the teachers and community service workers like us.
I suddenly realized I could answer the question my friend asked me at the beginning of the day.
Community service workers help others and make everyone feel better. There are so many people in the world that need help. Playing with lonely children may not make a big difference. But it can light a corner in the children’s hearts, making them know they are loved by people.
1.How did the writer reach Beijing Qizhi Special Education School?
A. By train B. By car. C. By bus. C. By taxi.
2.Why did the writer get angry?
A. Because a boy held the writer’s hands.
B. Because the writer did not like to taste nature.
C. Because a boy pushed the writer to the ground.
D. Because a boy was impolite to the writer.
3.The boy acted differently from others because _______.
A. he was sick
B. his parents didn’t like him
C. he was nervous and fearful
D. he always lived with teachers
4.The underlined word “abandoned” most probably means “_______”.
A. hurt B. left C. sold D. forgotten
5.From the passage we can learn that the writer __________.
A. helped so many people in the world
B. played with the lonely boy after lunch
C. learned the meaning of community service
D. wasn’t good at answering the questions about community service.
-
It was the last day of the final examination in a university. A group of students entered the classroom happily. This was their last exam. They knew it would
be easy. The professor had said that they could bring any book or note they wanted. The only requirement(要求) was that they couldn't talk with each other.
The professor handed out the papers. They were glad to find there were only five questions. Three hours passed. The professor asked, "How many of you have finished all the five questions?" None of the students answered.
"How many of 3'ou have finished four?" No answers again.
"Thee? Two?" The students moved restlessly (不安地) in their seats.
"One, then? Certainly somebody has finished one." But the class remained silent.
"That is exactly what I expected," the professor said. "I just want to teach you a lesson--although you have completed four years of study, there are still many
things you don't know about." Then be added, "You will all pass the exam, But remember: even though you are graduating from college, your education has just begun."
1.During the exam, the students could __
A. not take their notes
B. ask others for help
C. not talk with each other
D ask the professor for help
2.How many students passed the exam at last?
A. None of them. B. Only one.
C. Half of them. D. All of them.
3.What can we learn from the passage?
A The students thought the exam would be difficult.
B. The questions on the paper were easy to answer.
C. The professor had known the results of the exam.
D. The professor wasn't satisfied with of the exam.

