-
Frank made a survey about hobbies in his class which has half boys and half girls. All forty-seven of his classmates each have a hobby besides him. So ________students dislike ball games in his class.
Boys
Girls
Hobby
Football
Jogging
Reading
Table tennis
Percent
1/3
2/3
3/4
1/4
A.34 B.8 C.14
九年级英语单选题简单题查看答案及解析
-
A survey(调查) about the activity Helping the Homeless Children was made in Lucy and Lily's class. They and their 48 classmates took an active part in this activity. According to the form below, _____ students gave away school things.
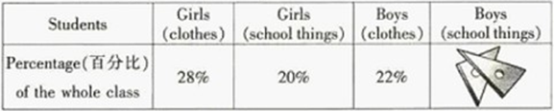
A. 24 B. 15 C.25
九年级英语单项填空中等难度题查看答案及解析
-
He made a joke about his friend. Which of the following is correct for the underlined word in the sentences?
A. [dʒæk] B. [dʒəʊk] C.[jek] D. [jeik]
九年级英语单项填空中等难度题查看答案及解析
-
A survey on “What apps students use to learn English” was made in Class 4, Grade 9 in Xinhua Middle School. There are 100 students in this class. One fifth of them don’t learn English by app. Then according to the form below, among the students who learn English by app, __________ students use Scallops Words.
BaiCiZhan
(百词斩)
Scallops Words
(扇贝单词)
Youdao Dictionary
(有道词典)
PowerWord
(金山词霸)
50%
?
10%
15%
A.40 B.20 C.12
九年级英语单选题中等难度题查看答案及解析
-
In our class, Frank is the only person _____ is good at clay art.
A.which B.that C.whom
九年级英语单选题中等难度题查看答案及解析
-
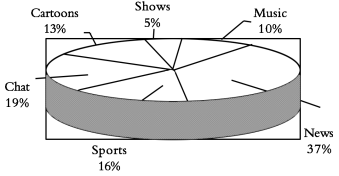
Last year, some groups of students in their community (社区) made a survey about "How do people spend their free time?" The following diagrams show some results of it:
Diagram (1): Hours for people of different ages who surf the Internet in a week.

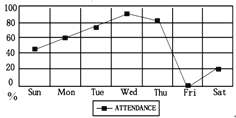
Diagram (2): Different days people go to the library. (library attendance)
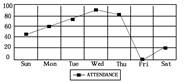
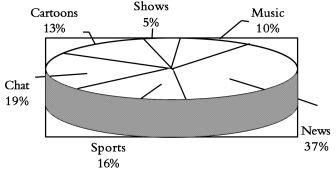
Diagram (3): Different programs people like.

根据上面三个图表内容,选择正确答案。
1.People aged ________ spend the most time surfing the Internet every week.
A.7—16 B.17—30 C.31—55 D.over 56
2.The word "attendance" in Diagram (2) means " ________ in the library".
A.the hours people spend B.the number of people
C.the number of books D.the days people spend
3.On weekends, ________ people go to the library every week.
A.over sixty B.less than sixty
C.about twenty D.more than one hundred
4.Which of the following is true according to the diagrams?
A.The fewest people like watching music.
B.Sports are the most people's favorite programs.
C.People seldom go to the library on weekdays.
D.Half of the people like watching news or cartoons.
5.The three diagrams show us the results of a survey about ________.
A.what people do every day
B.how people spend their free time
C.people's different lifestyles
D.people's different habits
九年级英语阅读理解中等难度题查看答案及解析
-
Last year, some groups of students in their community (社区) made a survey about “How do people spend their free time? ” The following diagrams(图表) show some results of it:
Diagram (1): Hours for people of different ages who surf the Internet in a week.
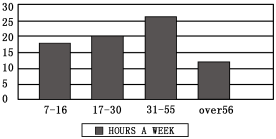
Diagram (2): Different days people go to the library. (library attendance)

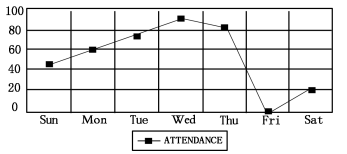
Diagram (3): Different programs people like.
1.People aged spend the most time surfing the Internet every week.
A. 7—16 B. 17—30 C. 31—55 D. over 56
2.The word “attendance” in Diagram (2) means “ in the library”.
A. the hours people spend B. the number of people
C. the number of books D. the days people spend
3.How many people go to the library on Saturdays?
A. About 20%. B. About 40%.
C. Over 60%. D. More than 80%.
4.Which of the following is TRUE according to the diagrams?
A. The fewest people like watching music programs.
B. Sports are the most people’s favorite programs.
C. People seldom go to the library on weekdays.
D. Half of the people like watching news and cartoons.
5.The three diagrams show us the results of a survey about .
A. what people do every day B. people’s different habits
C. people’s different lifestyles D. how people spend their free time
九年级英语阅读理解中等难度题查看答案及解析
-
Last year, some groups of students in their community made a survey about “How do people spend their free time? ” The following diagrams show some results of it:
Diagram (1): Hours for people of different ages who surf the Internet in a week.
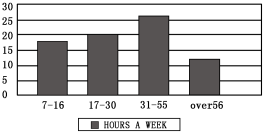
Diagram (2): Different days people go to the library. (library attendance)

Diagram (3): Different programs people like.
1.People aged spend the most time surfing the Internet every week.
A. 7—16 B. 17—30 C. 31—55 D. over 56
2. How many people go to the library on Saturdays?
A. About 20%. B. About 40%.
C. Over 60%. D. More than 80%.
3.Which of the following is TRUE according to the diagrams?
A. The fewest people like watching music programs.
B. Sports are the most people’s favorite programs.
C. People seldom go to the library on weekdays.
D. Half of the people like watching news and cartoons.
4. The three diagrams show us the results of a survey about
A. what people do every day
B. people’s different habits.
C. people’s different lifestyles
D. how people spend their free time
九年级英语阅读理解中等难度题查看答案及解析
-
Last year, some groups of students in their community made a survey about “How do people spend their free time?” The following diagrams show some results of it:
Diagram (1): Hours for people of different ages who surf the Internet in a week.
Diagram (2): Different days people go to the library. ( library attendance )
Diagram (3): Different sports people like.
D (1) D(2)

 D (3)
D (3)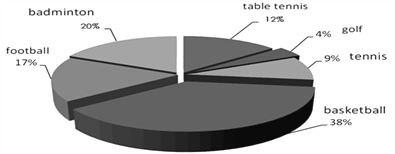
1.People aged spend the most time surfing the Internet every week.
A. 7~16 B. 17~30 C. 31~55 D. over 56
2.The word “attendance” in Diagram (2) means “ in the library”.
A. the hours people spend B. the number of people
C. the number of books D. the days people spend
3.How many people go to the library on Saturdays?
A. About 20%. B. About 40%.
C. Over 60%. D. More than 80%.
4.Which of the following is TRUE according to the diagrams?
A. The fewest people like playing tennis.
B. Football is the most people’s favorite sport.
C. People seldom go to the library on weekdays.
D. The most people like playing basketball.
5.The three diagrams show us the results of a survey about .
A. what people do every day B. people’s different habits
C. people’s different lifestyles D. how people spend their free time
九年级英语阅读单选困难题查看答案及解析
-
Last year, some groups of students in their community made a survey about “How do people spend their free time? ” The following diagrams(图表) show some results of it:
Diagram (1): Hours for people of different ages who surf the Internet in a week.
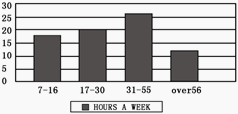
Diagram (2): Different days people go to the library. (library attendance)

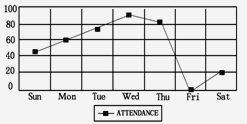
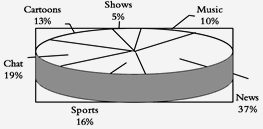
Diagram (3): Different programs people like.
1.People aged spend the most time surfing the Internet every week.
A. 7~16 B. 17~30 C. 31~55 D. over 56
2.How many people go to the library on Saturdays?
A. About 20%. B. About 40%. C. Over 60%. D. More than 80%.
3.Which of the following is TRUE according to the diagrams?
A. People seldom go to the library on weekdays.
B. Sports are the most people’s favorite programs.
C. The fewest people like watching music programs.
D. More people enjoy news programs than cartoons programs.
九年级英语阅读单选中等难度题查看答案及解析

