-
We have made a survey among 1,000 students from a middle school about their favorite food. _ students like fruits according to the form.
Kind of food
Chocolate
Banana
Cookie
Apple
Percentage(百分比)
Of the students
20%
30%
15%
?
A.350 B. 650 C.800
九年级英语单项填空中等难度题查看答案及解析
-
We made a survey among 2,000 students about their favorite movies. The number of the students who like science movies is_____more than that of the students who like documentary movies.
Type of movies
War
Science
Cartoon
Documentary
Number
20%
30%
600
?
A.100 B.200 C.300
九年级英语单选题中等难度题查看答案及解析
-
We made a survey among 1,000 middle school students about their masks (口罩)for the coming school days. In general, every student will prepare 200 masks for it. The form below shows that the number of each student’s medical masks is________as large as that of Kn95 respirators (Kn95口罩).
surgical (外科) masks
(medical)
disposable(一次性)masks
(medical)
Kn 95 respirators
100
50
?
A.twice B.three times C.four times
九年级英语单选题简单题查看答案及解析
-
Today we make a survey about the popularity of computer games among middle school students. Half of male students in our class like playing computer games very much. Though our teachers and their parents tell them not to play games any more again and again, they play the computer games daily and they don’t go to school. They spend a lot of time playing computer games each time, so they often ask their parents for money or borrow money from their classmates. Some students even use mobile phones to play the games in class. They don’t listen to the teacher carefully and usually forget to do their homework. I think it’s really bad for their lessons.
Playing computer games wastes money and it is also bad for students’ health and study. So I hope those who have got the habit of playing computer games could give it up as soon as possible.
Information Card
The popular activity among middle school students
1. .
Situation in playing games
2. in our class like playing computer games very much. Some students even3. in class.
Writer’s points
Playing computer games 4. and it is not good for 5. .
九年级英语其他题极难题查看答案及解析
-
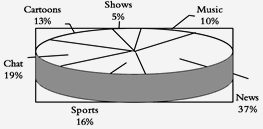
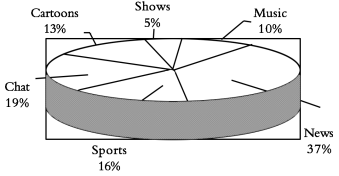
Last year, some groups of students in their community made a survey about “How do people spend their free time? ” The following diagrams show some results of it:
Diagram (1): Hours for people of different ages who surf the Internet in a week.
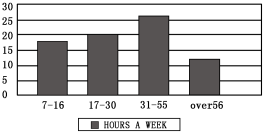
Diagram (2): Different days people go to the library. (library attendance)


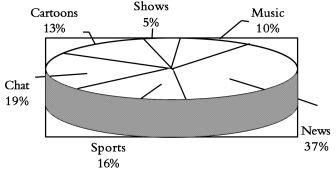
Diagram (3): Different programs people like.
1.People aged spend the most time surfing the Internet every week.
A. 7—16 B. 17—30 C. 31—55 D. over 56
2. How many people go to the library on Saturdays?
A. About 20%. B. About 40%.
C. Over 60%. D. More than 80%.
3.Which of the following is TRUE according to the diagrams?
A. The fewest people like watching music programs.
B. Sports are the most people’s favorite programs.
C. People seldom go to the library on weekdays.
D. Half of the people like watching news and cartoons.
4. The three diagrams show us the results of a survey about
A. what people do every day
B. people’s different habits.
C. people’s different lifestyles
D. how people spend their free time
九年级英语阅读理解中等难度题查看答案及解析
-
Last year, some groups of students in their community made a survey about “How do people spend their free time?” The following diagrams show some results of it:
Diagram (1): Hours for people of different ages who surf the Internet in a week.
Diagram (2): Different days people go to the library. ( library attendance )
Diagram (3): Different sports people like.
D (1) D(2)

 D (3)
D (3)
1.People aged spend the most time surfing the Internet every week.
A. 7~16 B. 17~30 C. 31~55 D. over 56
2.The word “attendance” in Diagram (2) means “ in the library”.
A. the hours people spend B. the number of people
C. the number of books D. the days people spend
3.How many people go to the library on Saturdays?
A. About 20%. B. About 40%.
C. Over 60%. D. More than 80%.
4.Which of the following is TRUE according to the diagrams?
A. The fewest people like playing tennis.
B. Football is the most people’s favorite sport.
C. People seldom go to the library on weekdays.
D. The most people like playing basketball.
5.The three diagrams show us the results of a survey about .
A. what people do every day B. people’s different habits
C. people’s different lifestyles D. how people spend their free time
九年级英语阅读单选困难题查看答案及解析
-
Last year, some groups of students in their community made a survey about “How do people spend their free time? ” The following diagrams(图表) show some results of it:
Diagram (1): Hours for people of different ages who surf the Internet in a week.
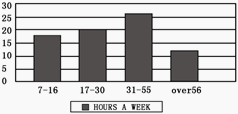
Diagram (2): Different days people go to the library. (library attendance)

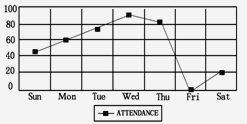
Diagram (3): Different programs people like.
1.People aged spend the most time surfing the Internet every week.
A. 7~16 B. 17~30 C. 31~55 D. over 56
2.How many people go to the library on Saturdays?
A. About 20%. B. About 40%. C. Over 60%. D. More than 80%.
3.Which of the following is TRUE according to the diagrams?
A. People seldom go to the library on weekdays.
B. Sports are the most people’s favorite programs.
C. The fewest people like watching music programs.
D. More people enjoy news programs than cartoons programs.
九年级英语阅读单选中等难度题查看答案及解析
-
Last year, some groups of students in their community (社区) made a survey about "How do people spend their free time?" The following diagrams show some results of it:
Diagram (1): Hours for people of different ages who surf the Internet in a week.

Diagram (2): Different days people go to the library. (library attendance)
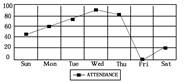
Diagram (3): Different programs people like.

根据上面三个图表内容,选择正确答案。
1.People aged ________ spend the most time surfing the Internet every week.
A.7—16 B.17—30 C.31—55 D.over 56
2.The word "attendance" in Diagram (2) means " ________ in the library".
A.the hours people spend B.the number of people
C.the number of books D.the days people spend
3.On weekends, ________ people go to the library every week.
A.over sixty B.less than sixty
C.about twenty D.more than one hundred
4.Which of the following is true according to the diagrams?
A.The fewest people like watching music.
B.Sports are the most people's favorite programs.
C.People seldom go to the library on weekdays.
D.Half of the people like watching news or cartoons.
5.The three diagrams show us the results of a survey about ________.
A.what people do every day
B.how people spend their free time
C.people's different lifestyles
D.people's different habits
九年级英语阅读理解中等难度题查看答案及解析
-
Last year, some groups of students in their community (社区) made a survey about “How do people spend their free time? ” The following diagrams(图表) show some results of it:
Diagram (1): Hours for people of different ages who surf the Internet in a week.
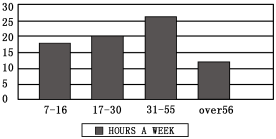
Diagram (2): Different days people go to the library. (library attendance)
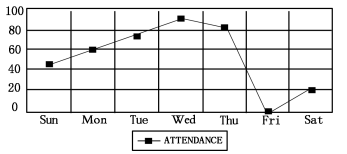
Diagram (3): Different programs people like.
1.People aged spend the most time surfing the Internet every week.
A. 7—16 B. 17—30 C. 31—55 D. over 56
2.The word “attendance” in Diagram (2) means “ in the library”.
A. the hours people spend B. the number of people
C. the number of books D. the days people spend
3.How many people go to the library on Saturdays?
A. About 20%. B. About 40%.
C. Over 60%. D. More than 80%.
4.Which of the following is TRUE according to the diagrams?
A. The fewest people like watching music programs.
B. Sports are the most people’s favorite programs.
C. People seldom go to the library on weekdays.
D. Half of the people like watching news and cartoons.
5.The three diagrams show us the results of a survey about .
A. what people do every day B. people’s different habits
C. people’s different lifestyles D. how people spend their free time
九年级英语阅读理解中等难度题查看答案及解析
-
A survey about cycling to work was made among two hundred people. According tothe result below, the people who choose cycling because of health and fitness are _______ more than those who choose cycling because of no parking problems.
Health and fitness
No costs
Less pollution
Faster than driving
No parking problems
?
30%
13%
15%
12
A. 60 B. 72 C. 30
九年级英语单选题中等难度题查看答案及解析

